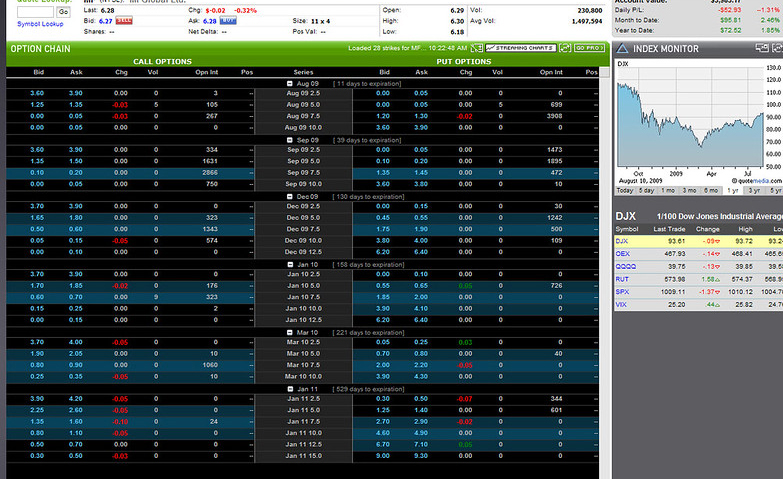
Traders and investors comprehending the intricacies of the stock market require crucial tools to navigate efficiently. In such scenarios, the option chain emerges as a valuable assistant.
These visual representations of option contracts provide a wealth of information. From strike prices and implied volatility to open interest or premium, they assist traders in making an informed decision.
In this guide, we will dive into the intricacies of option chain charts and explain how to use them for successful trading strategies. So join us as we explore further.
What is an option chain?
It is a matrix that consists of all available contracts for investors. They are available for individual stocks and market indices. To look for the options available, you can simply select a stock market index and find all the information you require. Interest, type, premium, and other details will be displayed so you can analyse them and make an informed decision.
After learning what is option chain, let us take a look at the important metrics.
Critical metrics offered in the option matrix
- Executed price
- Ask quantities
- Real-time bid
- Bid quantities
- Ask prices
Such metrics allow investors to evaluate the depth and liquidity for specific strikes.
Significance of the option chain
As a comparison of each contract is available individually, investors do not have to waste time. Apart from this, traders can utilise option chains to understand the current market sentiment. Additionally, by employing volatility, investors are able to gauge pricing options and manage risks. Understanding the liquidity of different strike prices enables traders to choose contracts that are easier to trade.
Usage of option chains
Such data can be easily found online for analysis. To access the same, you can use platforms like Research 360 or visit the official stock exchange website. Here are a few reasons why it is important:
- Investors can access the striking price to create effective strategies.
- You can receive warning signals in case of anomalies in the associated index.
- Traders gain useful insights into the index movement with the help of an option chart.
- Easy comparison of a vast amount of data is the biggest advantage of using such a matrix.
- It provides a quantitative overview of the stock, making assessment easier.
How to become an option chart expert?
Novice investors might ignore the importance of this matrix. As a result, they might not be knowledgeable enough to open interest or look at the trading volume. To achieve the skill of decoding option charts, you will require a combination of knowledge and discipline. Here is a step-by-step guide to assist you in this journey.
1. Understanding the basics
You do not have to take up a course to become an expert in option chains. Simply by learning the fundamentals of options trading, including calls, puts, and more, one can do the job. Familiarise yourself with common strategies like spreads and strangles to gain an upper hand.
2. Master the components
- To become an expert, you must know what each component in the table means. Here is a detailed guide:
- Understand how strike prices relate to the underlying asset price and how they affect option premiums.
- Learn the impact of implied volatility and see how it measures the market experience of price fluctuations.
- You can gauge the options chart by understanding the significance of open interest in determining market sentiments and liquidity.
- Trading volume denotes the number of contracts available in a day. By monitoring them closely, you can assess the interest of the investors.
- Finally, by studying the option geeks, you will be able to gain insight into how prices change in response to different factors.
3. Additional practices
Real-time analysis and historical option chain data will also provide you with an edge while trading. Incorporating backtesting software serves as an important strategy for risk management. Finally, continuous learning lets you stay updated and gain an edge over your counterparts.
Bottom line
To conduct such an exploration, you must rely on a dependable platform like Research 360, as it provides authentic information. You can set yourself up for success with consistent practice and continuous learning.
DISCLAIMER – “Views Expressed Disclaimer: Views and opinions expressed are those of the authors and do not reflect the official position of any other author, agency, organization, employer or company, including NEO CYMED PUBLISHING LIMITED, which is the publishing company performing under the name Cyprus-Mail…more


